|
|
TieBa MMA — Mathematica 激活指南
百度mathematica吧精品贴备份
[Mathematica 12] Complex Visualization
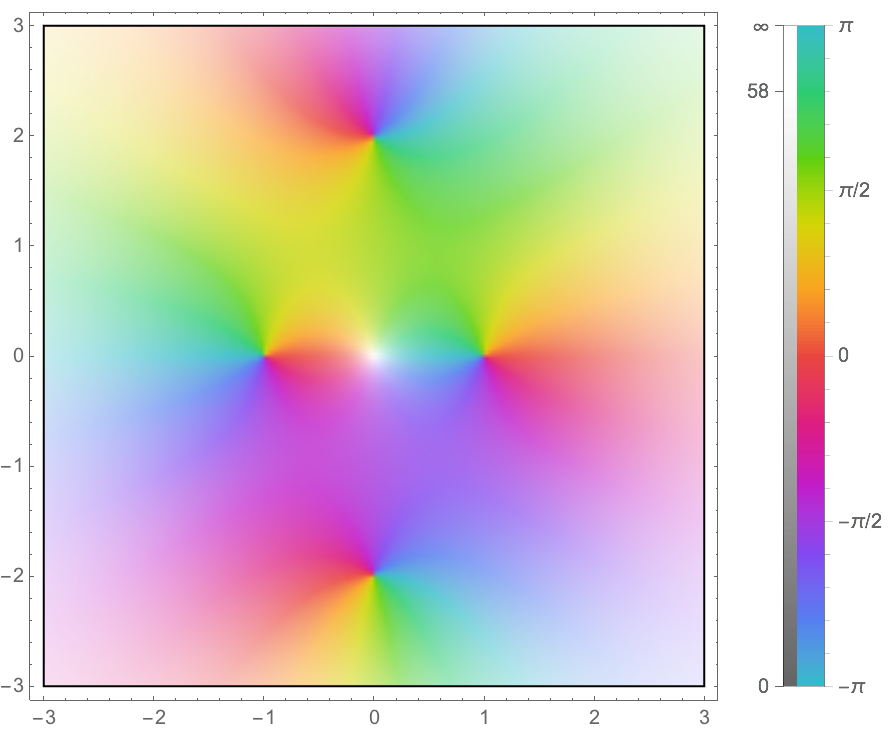
Use ComplexPlot or ComplexPlot3D to plot a complex-valued function over the complex numbers. Colors correspond to the arguments of the function values over the complex plane. In ComplexPlot, as the absolute value gets larger, the plot gets paler.
- ComplexPlot[(z^4 + 3 z^2 - 4)/z, {z, -3 - 3 I, 3 + 3 I}, PlotLegends -> Automatic]

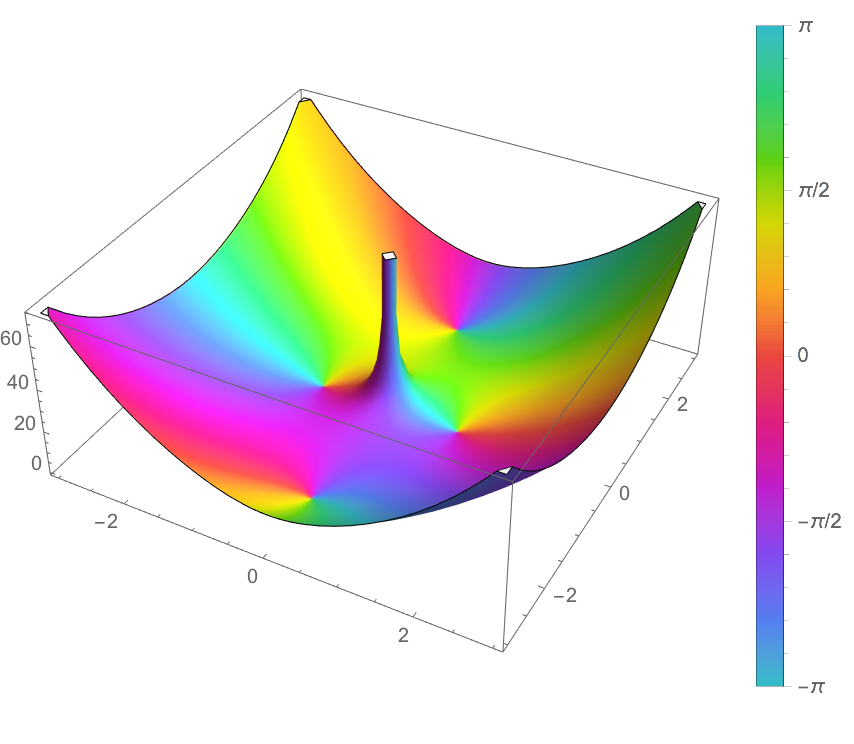
ComplexPlot3D uses the height to display the absolute value.
- ComplexPlot3D[(z^4 + 3 z^2 - 4)/z, {z, -3 - 3 I, 3 + 3 I}, PlotLegends -> Automatic]

|
|